
Wine Preference Analysis
Who doesn't like a good glass of wine, right?
The objective of this analysis is to find out what wine would be perfect for our target audience using conjoint analysis
With the mission to discover customer preferences, we noted the following 4 attributes and respective levels:

Type
3 levels:
Red, White, Rose

Taste
2 levels:
Dry & Woody, Sweet & Fruity

Occasion
2 levels:
Special Occasion, Social Gathering

Price
3 levels:
$10, $30, $50

Using a factorial design, we created 12 profiles and surveyed respondents with a scale of 1-9 (1 being extreme dislike and 9 being extreme like)
Basis their preferences, we started with the analysis, one person at a time
Randomly selecting one respondent, we ran a regression and analyzed her part-worth with the
Base: Sweet & Fruity, Social, Rose, $50
Using that, we understood what's her best and worst product configurations.
Best: Sweet & Fruity, Special event, Rose, $10
Worst: Dry & Woody, Special event, Red, $30
(This respondent likes her sweet rose priced at $10 🍷)


Next, we wanted to find out how important is each attribute to her, and turns out the 3 attributes i.e. taste, occasion, and price are equally important to her. The respondent would be mostly impartial to a change in occassion.
Lastly, I wanted to observe how price sensitive are our respondents. Here's a sample of 5 of them:


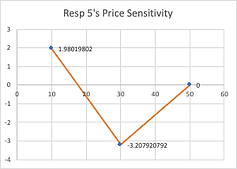
As we can observe, 3 out of 5 respondents are more price sensitive and their likelihood of buying reduces as price increases. Surpringly enough, 2 of them are willing to pay $50 wine but not a $30 wine. One hypothesis could be that they believe wines in the range of $10-$30 taste similar which is why they'd rather pay $10 for it. However, they are ready to pay $50 if they see price as an indicator of quality which is quite common in such products.
We then created profiles of 2 competitive products (X and Y) and given our market of 10 individuals, we computed the market share of each profile. These were the 2 profiles and respective market shares:
X: Dry & Woody, Red, Special Occasions, $10 (80% share)
Y: Sweet & Fruity, Rose, Social Gatherings, $30 (20% share)
As the last step, we wanted to create our products and see how market share would be impacted:
A: Dry & Woody, Red, Social Gatherings, $50
B: Sweet & Fruity, Red, Special Events, $50
C: Dry & Woody, White, Special Events, $10

...& we clearly found our winner!
Product C is a winning wine product that would take 20% market share not only from Y but from the leader, X as well.