Market Response Modeling
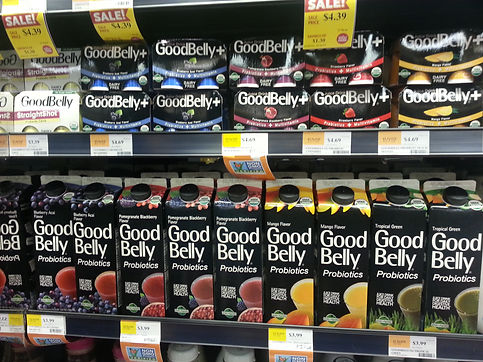
Goodbelly, a probiotic product line launched in January 2008, initiated in-store demonstrations in specific Whole Foods regions from May to July 2010. The primary objective is to assess the impact of in-store demonstrations on sales and profitability.
Context
To achieve this goal, data from two regions, namely Rocky Mountain (RM) and Northeast (NE), has been collected. The dataset includes information on:
-
Units sold
-
Retail Price
-
Demo Dummy code (1= demo occurred, 0= demo didn't occur)
-
Demo 1-3 Dummy code (1= demo occurred 1-3 weeks ago, 0= demo didn't occur 1-3 weeks ago)
To understand the relationship between sales and other variables, I first ran linear regressions for sales as a linear function of price for each region.
RM Region

NE Region

Here are 3 key insights:
-
As retail price increases, the sales reduces in both the region
-
RM Region seems to be more price sensitive, as when the price increases by 1%, the sales in RM Region drop by 76%
-
When a store had a demo in the past 3 weeks, the sales tend to increase. Especially, RM Region is more responsive to an in-person demo
To dive deeper and identify overarching trends, I pooled the data together of both regions and ran another linear regression.
We can observe that all variables are again statistically significant and the effect of demo is positively correlated with the sales
But..are the coefficients statistically different across regions?
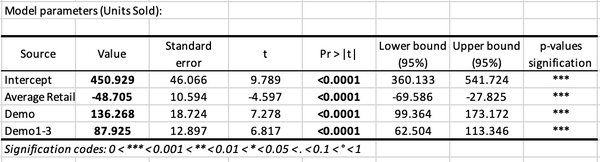
To find that out, I created interaction variables to determine if the price coefficient and demo/demo1-3 coefficients are statistically different. I ran 4 more regressions with the following variables:
a) Different intercepts
b) Different intercepts and price coefficients
c) Different intercepts and demo/demo 1-3 coefficients
d) All together
Based on the results, I chose model 2 as all variables were significant and it had the highest adjusted R square

As the next step, I used these parameters to test for the effect of running demos in all stores in both regions for the week of July 20, 2010. The model includes any dynamic effect of the demonstrations estimated to be present in the data. I assumed the retail price in the week of 20th July will remain the same as the price in the previous week.
Assuming retail margins of 30% and manufacturer margins of 50% (constant across regions, stores, and weeks), I found expected profits for Goodbelly.

The profits WITH the dynamic demo effect come to about $39,000. I was also curious to find out the importance of the dynamic demo effect in the weeks after a promotion, so I built a model WITHOUT the dynamic effect and calculated profits as seen below

As we can see, the total expected profits without the dynamic demos drop by ~12%, thereby showing the positive impact of demos